
EOST Loading Service
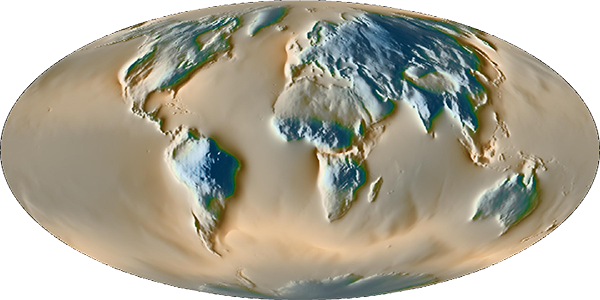
This service allows the plot of atmospheric, hydrological and oceanic non-tidal loading estimates from various models at the Global Geodynamics Project sites (and some others). It also allows the plot of Earth rotation and its induced ocean tide loading effects at these same sites.
Note that only one point by day is plotted for hydrological loading estimates,
but also, for all type of data, when time range is greater than one year.
Plots may be printed and saved with the 'Print'/'Print to file' menu of your browser.